
Файл:EfieldTwoOppositePointCharges.svg

Size of this PNG preview of this SVG file: 619 × 438 пиксел. Бусад зургын нягтрал: 320 × 226 пиксел | 640 × 453 пиксел | 1,024 × 725 пиксел | 1,280 × 906 пиксел | 2,560 × 1,811 пиксел.
Эх файл (SVG файл, 619 × 438 пиксэл, файлын хэмжээ: 187 КБ)
Товч агуулга
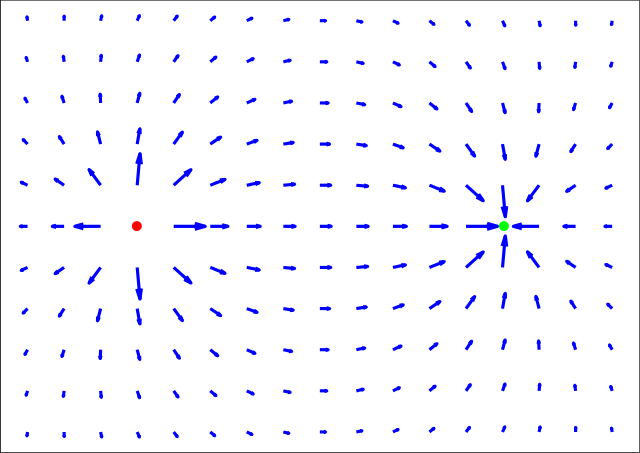
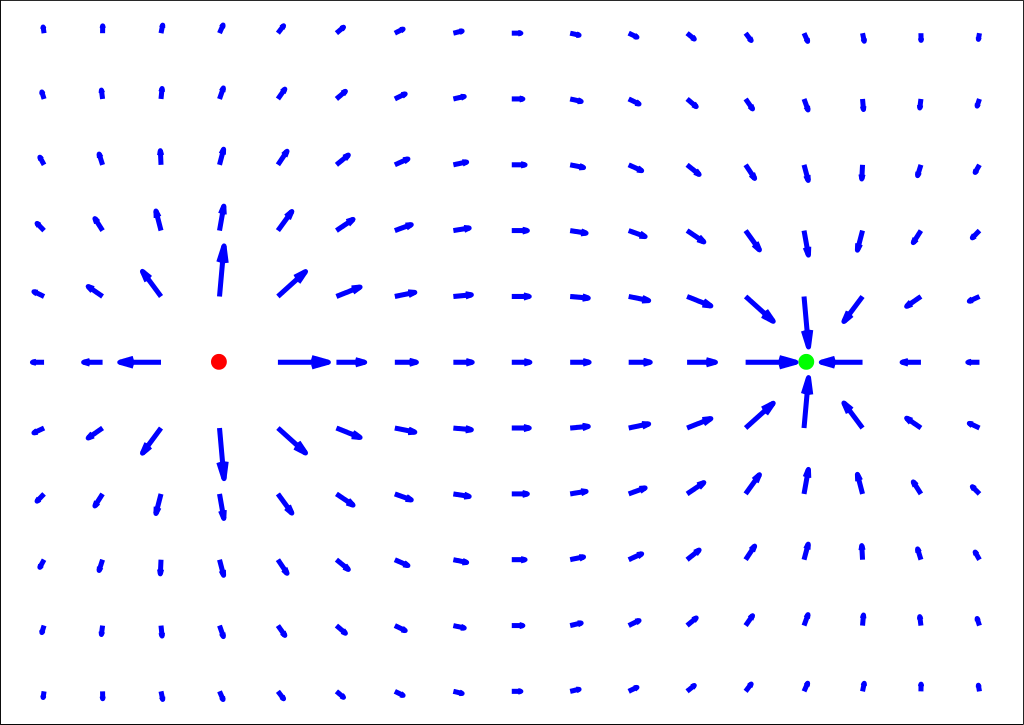
| Тайлбар | Illustration of the electric vectorfield surrounding two opposite point charges. Red is positive, green is negative. |
| Огноо | |
| Эх үүсвэр | Own work. Vectorfield plotted in Matlab using the 'quiver' function. Exported in Encapsulated Postscript (EPS) format; converted to Scalable Vector Graphics (SVG) format in GSView using 'plot-svg' via GNU libplot. Added circle drawings in Inkscape (GNU General Public License). |
| Зохиогч | Mfrosz |
| Зөвшөөрөл (Энэ файлыг дахин ашиглах) |
Free for use by anyone for anything, but please give credit to Wikimedia or Wikipedia. |
| SVG genesis |
Лиценз
| I, the copyright holder of this work, release this work into the public domain. This applies worldwide. In some countries this may not be legally possible; if so: I grant anyone the right to use this work for any purpose, without any conditions, unless such conditions are required by law. |
Файлын түүх
Огноо/цаг дээр дарж тухайн үеийнх нь файлын байдлыг харна уу.
| Огноо/Цаг | Жижиг зураг | Хэмжээ | Хэрэглэгч | Тайлбар | |
|---|---|---|---|---|---|
| одоогийн | 10:41, 12 Наймдугаар сар 2006 | | 619 × 438 (187 КБ) | Mfrosz | {{Information |Description=Illustration of the electric vectorfield surrounding two opposite point charges. Red is positive, green is negative. |Source=Own work. Vectorfield plotted in Matlab using the 'quiver' function. Exported in Encapsulated Postscrip |
Холбоос
Дараахь хуудсууд уг файлтай холбогдсон байна:
Файлын хэрэглээ (бүх төсөл)
Дараах бусад вики энэ файлыг ашигладаг:
- am.wikipedia.org дахь хэрэглээ
- ar.wikipedia.org дахь хэрэглээ
- bg.wikipedia.org дахь хэрэглээ
- ca.wikipedia.org дахь хэрэглээ
- cs.wikibooks.org дахь хэрэглээ
- de.wikipedia.org дахь хэрэглээ
- en.wikipedia.org дахь хэрэглээ
- en.wikibooks.org дахь хэрэглээ
- en.wiktionary.org дахь хэрэглээ
- et.wikipedia.org дахь хэрэглээ
- fa.wikipedia.org дахь хэрэглээ
- fr.wikipedia.org дахь хэрэглээ
- gor.wikipedia.org дахь хэрэглээ
- he.wikipedia.org дахь хэрэглээ
- he.wiktionary.org дахь хэрэглээ
- hr.wikipedia.org дахь хэрэглээ
- hu.wikipedia.org дахь хэрэглээ
- id.wikipedia.org дахь хэрэглээ
- is.wikipedia.org дахь хэрэглээ
- nl.wikipedia.org дахь хэрэглээ
- no.wikipedia.org дахь хэрэглээ
- oc.wikipedia.org дахь хэрэглээ
- pl.wikipedia.org дахь хэрэглээ
- ro.wikipedia.org дахь хэрэглээ
- sh.wikipedia.org дахь хэрэглээ
- sl.wikipedia.org дахь хэрэглээ
- sr.wikipedia.org дахь хэрэглээ
- sv.wikipedia.org дахь хэрэглээ